Orphan Nodes or Leaking Memory
When developing in Godot, it’s important to ensure that objects are properly freed, otherwise they become orphan nodes that can lead to memory leaks. This is especially important when writing tests, where you may not know if all objects created during the test have been properly freed.
One helpful tool for managing objects is to use the auto_free function.
Monitoring
GdUnit helps you monitor for orphan nodes by counting any detected orphan nodes for each test run in the Status Bar, and reporting them in the Failure Report for the currently selected test.
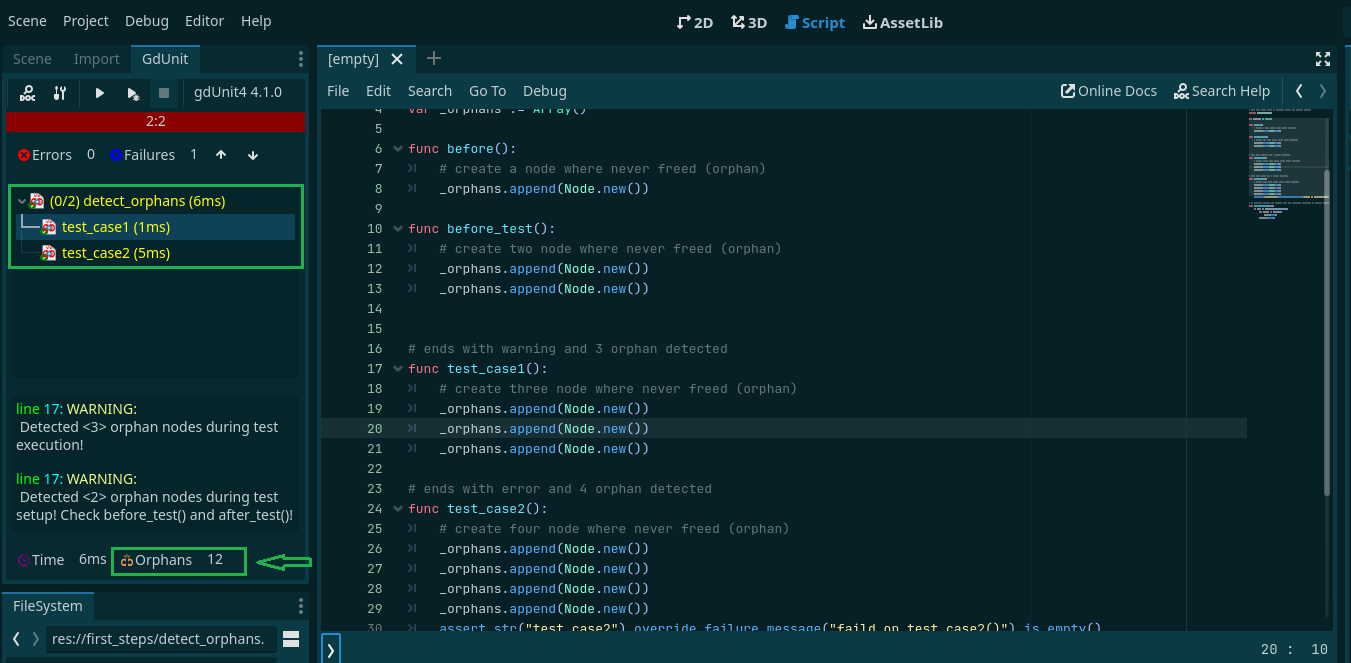
The Status Bar lets you step through every test that detected orphan nodes, not just the first one. Orphan nodes are reported for each test step, including before(), before_test(), and the test itself.
Detailed Orphan Reporting
By default, GdUnit only reports how many orphan nodes a test produced, shown as a plain warning like in the screenshot above. Capturing the detail behind each orphan has a runtime cost, so it’s opt-in: call collect_orphan_node_details() at the point GdUnit’s hint suggests, and the report itemizes every detected orphan node instead, including its class, instance ID, and the exact source line where it was created.
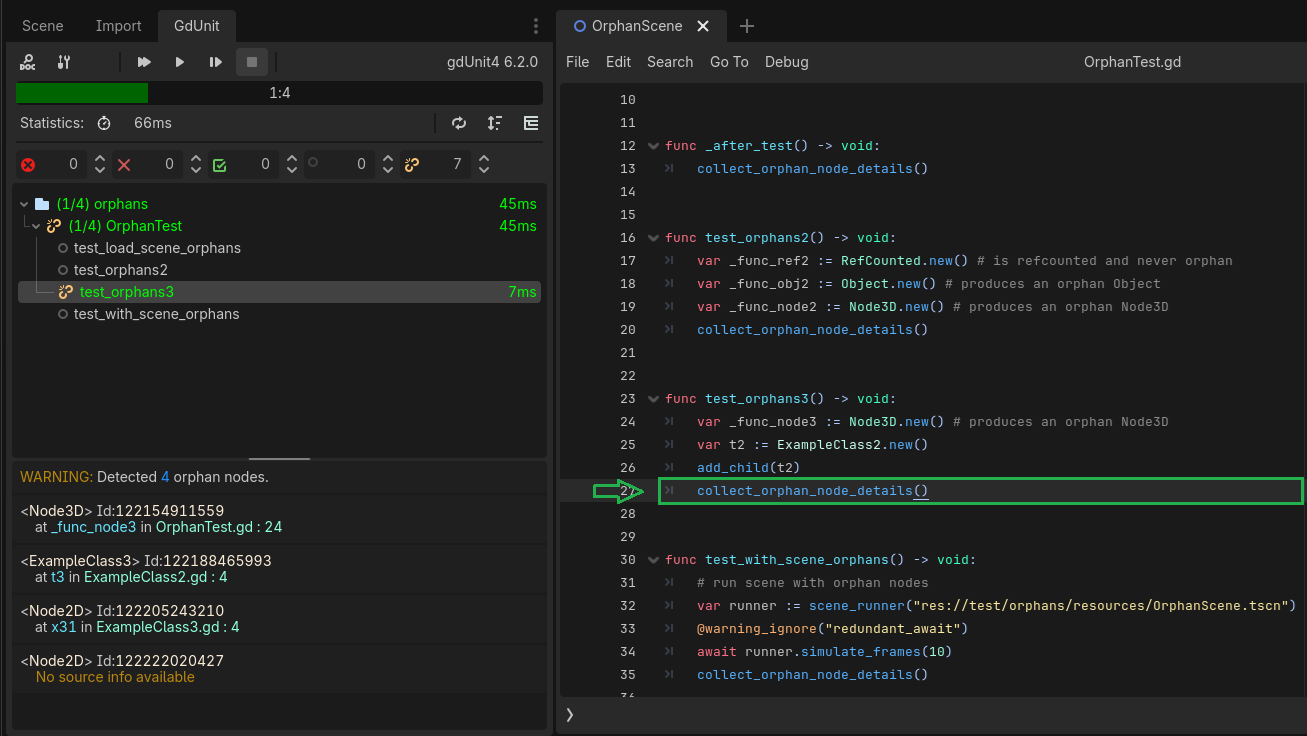
Orphan detection reports a full stack trace for each orphan node (requires Godot 4.5+), including the variable name, script path, and line number where the node was created. This makes it significantly easier to locate the source of a leak without manual investigation.
Godot’s API doesn’t expose creation-site information for every kind of object, so a stack trace isn’t always available. In that case the report shows No source info available for that entry instead, as in the screenshot above.
 Advice
 See Fixing Orphan Nodes for a step-by-step walkthrough.