The GdUnit Test Inspector
The GdUnit Test Inspector is your entry point for running tests and reviewing their results. This page explains what each part of the inspector shows; for the different ways to trigger a test run, see How to Run Tests.
Overview
The GdUnit inspector provides an overview of the currently executed tests and allows you to navigate them. It allows you to select individual tests and view possible test failures, including the full call stack. The integrated status bar gives you a quick overview of the last test run, including elapsed time and orphan nodes.
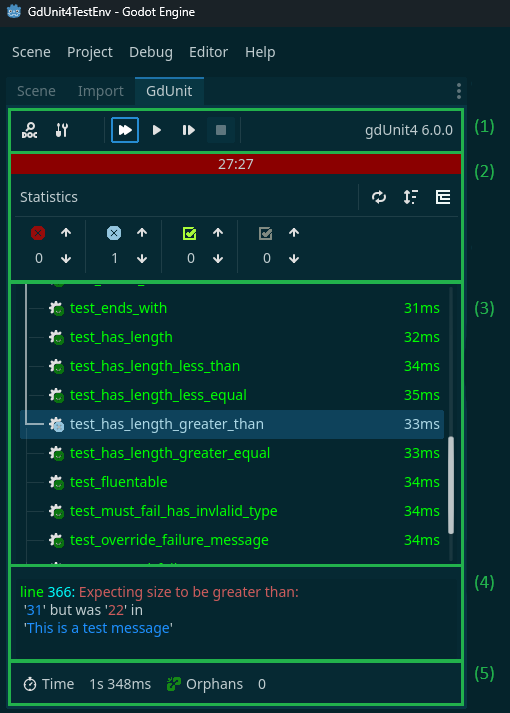
- (1) Button Bar
- (2) Status Bar
- (3) Test Run Overview
- (4) Failure Report
Button Bar
The button bar contains several buttons that allow you to perform different actions in GdUnit: 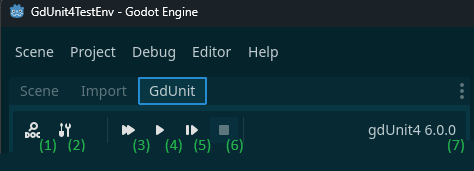
| Preview | Description |
|---|---|
 | Opens the GdUnit documentation page in your browser |
 | Opens the GdUnit settings window |
 | Run Overall tests |
 | (Re)Run the tests in runtime mode |
 | (Re)Run the tests in debug mode |
 | Stops the current test run |
| Displays the version of GdUnit |
Note that the keyboard shortcuts for these buttons may vary depending on your specific GdUnit configuration.
The Run Overall Button
The Run Overall button provides a convenient way to execute all the tests in your project at once, instead of running them one by one or selecting a custom set of tests. By clicking the “Run Overall” button, you can initiate the execution of all the tests in your project, saving you time and effort. 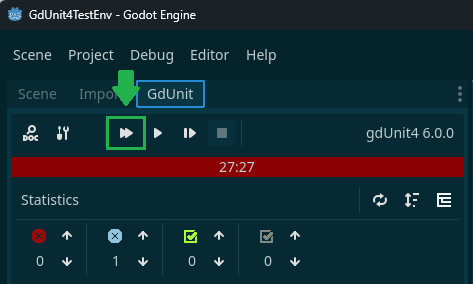 To enable the Run Overall button in GdUnit4, you need to adjust the UI settings.
Once you have enabled the Run Overall button, it should be visible in the inspector.
Status Bar
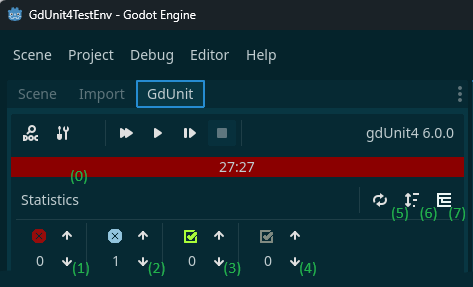
This area gives you information about the current/last test execution, such as the progress, the elapsed time, and errors/failures/orphans found.
With the arrow buttons, you can navigate back and forth over found failures, errors, flaky tests, skipped tests, and orphan nodes.
-
Indicators
Preview Description 
Test execution progress (indicator of test run) 
Number of errors (parse/runtime errors) 
Number of failures 
Number of flaky tests 
Number of skipped tests 
Number of detected orphan nodes -
Controls
Preview Description 
Rediscover tests (rescans the project for testsuites without running them) 
Change sort tree mode (asc/desc/time) 
Change the test tree presentation (tree/flat) -
Sorting Options
The sorting option controls how the test results are displayed in the inspector tree. You can sort the results by:
- Unsorted: The natural order.
- Name Ascending: Sorts the test cases alphabetically from A to Z.
- Name Descending: Sorts the test cases alphabetically from Z to A.
- Test Execution Time: Sorts the test cases based on the time they took to execute, from longest to shortest.
-
Tree Presentation
The tree presentation setting allows you to switch between two views:
- Flat View: Displays all test cases in a single, flat list without any hierarchical structure.
- Tree View: Displays test cases in a hierarchical structure, reflecting the path of your test files and suites.
Test Run Overview Tree
This area provides an overview of all executed/executing tests and their execution status in real-time. Each entry shows its execution time and, when a test was retried (for example a flaky test or a test run with Run Tests Until Fail), the number of retries. Here, you can navigate through the tests and view the report for each individual test by selecting it. You can also run the currently selected test or test suite again by right-clicking to open a context menu. 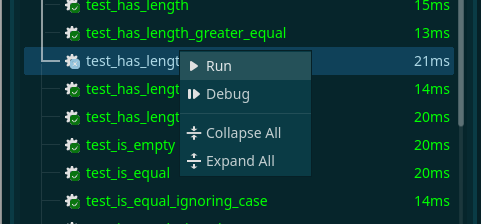
Each test is prefixed with an icon showing its outcome:
| Icon | Meaning |
|---|---|
 | Passed |
 | Failed (a used assert reported a mismatch) |
 | Error (an unhandled runtime error or script error) |
 | Flaky (failed at least once but passed on retry) |
 | Skipped |
 | Orphan nodes detected — shown instead of the pass/fail icon, even if the test itself passed |
 Advice
 GdUnit distinguishes between errors and failures. An error is a hard failure such as a test abort or timeout, while a failure is a test error caused by a failed assertion.
Advice Failure Report
This area displays the failure report of the currently selected failed test.
GdUnit generates the failure report based on the used assert, according to the scheme expected vs current value, followed by the full call stack that led to the failure. Every stack frame is clickable and jumps straight to the corresponding source line. 
For tests with detected orphan nodes, this area reports differently — see Orphan Nodes or Leaking Memory for details.